Karl
Hartig
charts, diagrams,
data visualization
charts, diagrams,
data visualization
|
Karl
Hartig
charts, diagrams, data visualization |
|
 |
|
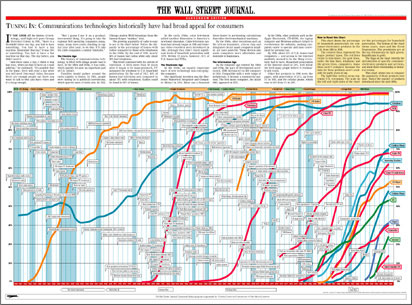
Consumer Electronics
This chart shows the percentage of households using consumer electronics products in the U.S. from 1920 to 1998. The major product catagories are television, radio, telephone, computers. The flags identify the introduction of specific products and services, and show their relationship to historical events. |