Karl
Hartig
charts, diagrams,
data visualization
charts, diagrams,
data visualization
|
Karl
Hartig
charts, diagrams, data visualization |
|
 |
|
Information Age
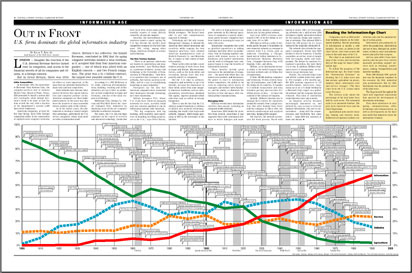
The chart tracks the 'Information Economy' by dividing the U.S. labor force into four sectors: agriculture (in green), industry (blue), information (red) and service (orange). The vertical scale shows the percentage of the total labor force held by each sector. From 1800 through 1900, agriculture was the dominant employer in the economy. By 1910 it was industrial jobs and by 1960, information was the primary sector of the labor force. |