Karl
Hartig
charts, diagrams,
data visualization
charts, diagrams,
data visualization
|
Karl
Hartig
charts, diagrams, data visualization |
|
 |
|
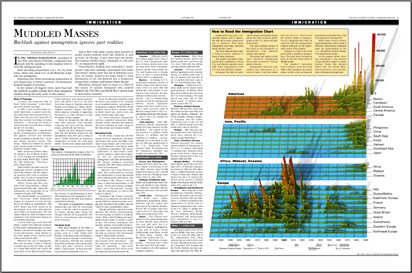
Immigration
The three-dimensional graphic assembles immigration data compiled by various U.S. government agencies since 1820. While some events encouraged immigration, others made it difficult: Depressions tightened job opportunities in the U.S., and global conflicts disrupted transportation. |