Karl
Hartig
charts, diagrams,
data visualization
charts, diagrams,
data visualization
|
Karl
Hartig
charts, diagrams, data visualization |
|
 |
|
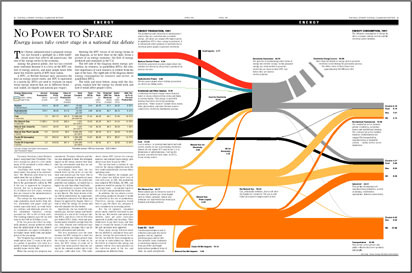
Energyflow in BTUs
The left side of the diagram shows energy production, the right side shows energy consumption. All values are annual 1991 figures given in quadrillion BTUs. The gray area in the center is the generation of electricity. More than two-thirds of energy used to generate electricity is lost during the generation process. The dollar value of these losses was approximately $50 billion in 1991. |