Karl
Hartig
charts, diagrams,
data visualization
charts, diagrams,
data visualization
|
Karl
Hartig
charts, diagrams, data visualization |
|
 |
|
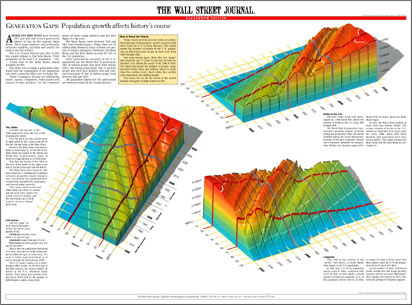
U.S. Population Changes
Three views of a three-dimensional model created with U.S. Census data. The model is a visualization of the distribution of people in the U.S. population from birth to age 100, for each year from 1900 through 2050. The wave down the middle is the Baby Doom moving though time. The valley in front of it is the effect of The Great Depression on the birth rate. |
